Markets Heat Up in July
Favorable economic data fuels risk assets as markets post solid gains during July
By Crescent Team
KEY OBSERVATIONS
• Markets posted favorable returns in July as investors found renewed optimism in economic data being reported, even in the face of year-over-year earnings declines.
• The Federal Reserve raised rates in July, now targeting 5.25-5.5% for the Fed funds rate. Markets have all but priced in a pause at this level for the remainder of the year.
• Private credit has garnered attention. The asset class has the potential to provide portfolio diversification and yield above traditional fixed income, but investors must consider the added cost, reduced liquidity and increased credit risk when contemplating an allocation.
MARKET RECAP
Financial markets were hot in July, starting the second half of the year off with a bang. There was a clear appetite for riskier segments of the market as equities generally outperformed fixed income. Even in the face of negative year-over-year earnings growth so far for the second quarter, favorable economic data helped bolster returns. The U.S. economy grew by 2.4% in the second quarter according to the advance estimate from the BEA(1) and inflation continued to moderate as well, with year-over-year CPI touching 3% in June.(2) U.S. equities performed well, posting mid-single digit returns. Small capitalization stocks (Russell 2000 Index) outpaced large cap companies (S&P 500 Index) during the month, driven in large part by strong smaller regional bank performance relative to large money center banks. Non-U.S. markets also posted favorable returns, with both developed and emerging markets in positive territory. Emerging regions (MSCI Emerging Markets Index) fared better than developed (MSCI EAFE Index) on the back of strong performance from China, Columbia and South Africa. Europe, however, lagged as the region continues to grapple with sluggish economic activity and higher inflation.

Fixed income was mixed as interest rate volatility remained. Ultimately the U.S. 10-year Treasury yield ended the month at 3.97 %, 16 basis points higher than it began. The seemingly favorable economic backdrop and appetite for risk helped propel longer yields higher, while the Federal Reserve increased the federal funds rate another 0.25 percentage points (now targeting 5.25-5.50%), pushing short-term rates up. (3) The propensity for risk played out in the bond market as well as corporate high yield posted a positive return, supported by stronger than anticipated economic data. Diversifying areas of the market, such as REITs and commodities, were positive as well. In a notable shift this year, the office sub-sector saw a double-digit gain during the month on the back of growing leasing volume and positive sentiment stemming from a notable transaction from one of New York City’s largest office landlords.
PRIVATE CREDIT CONSIDERATIONS
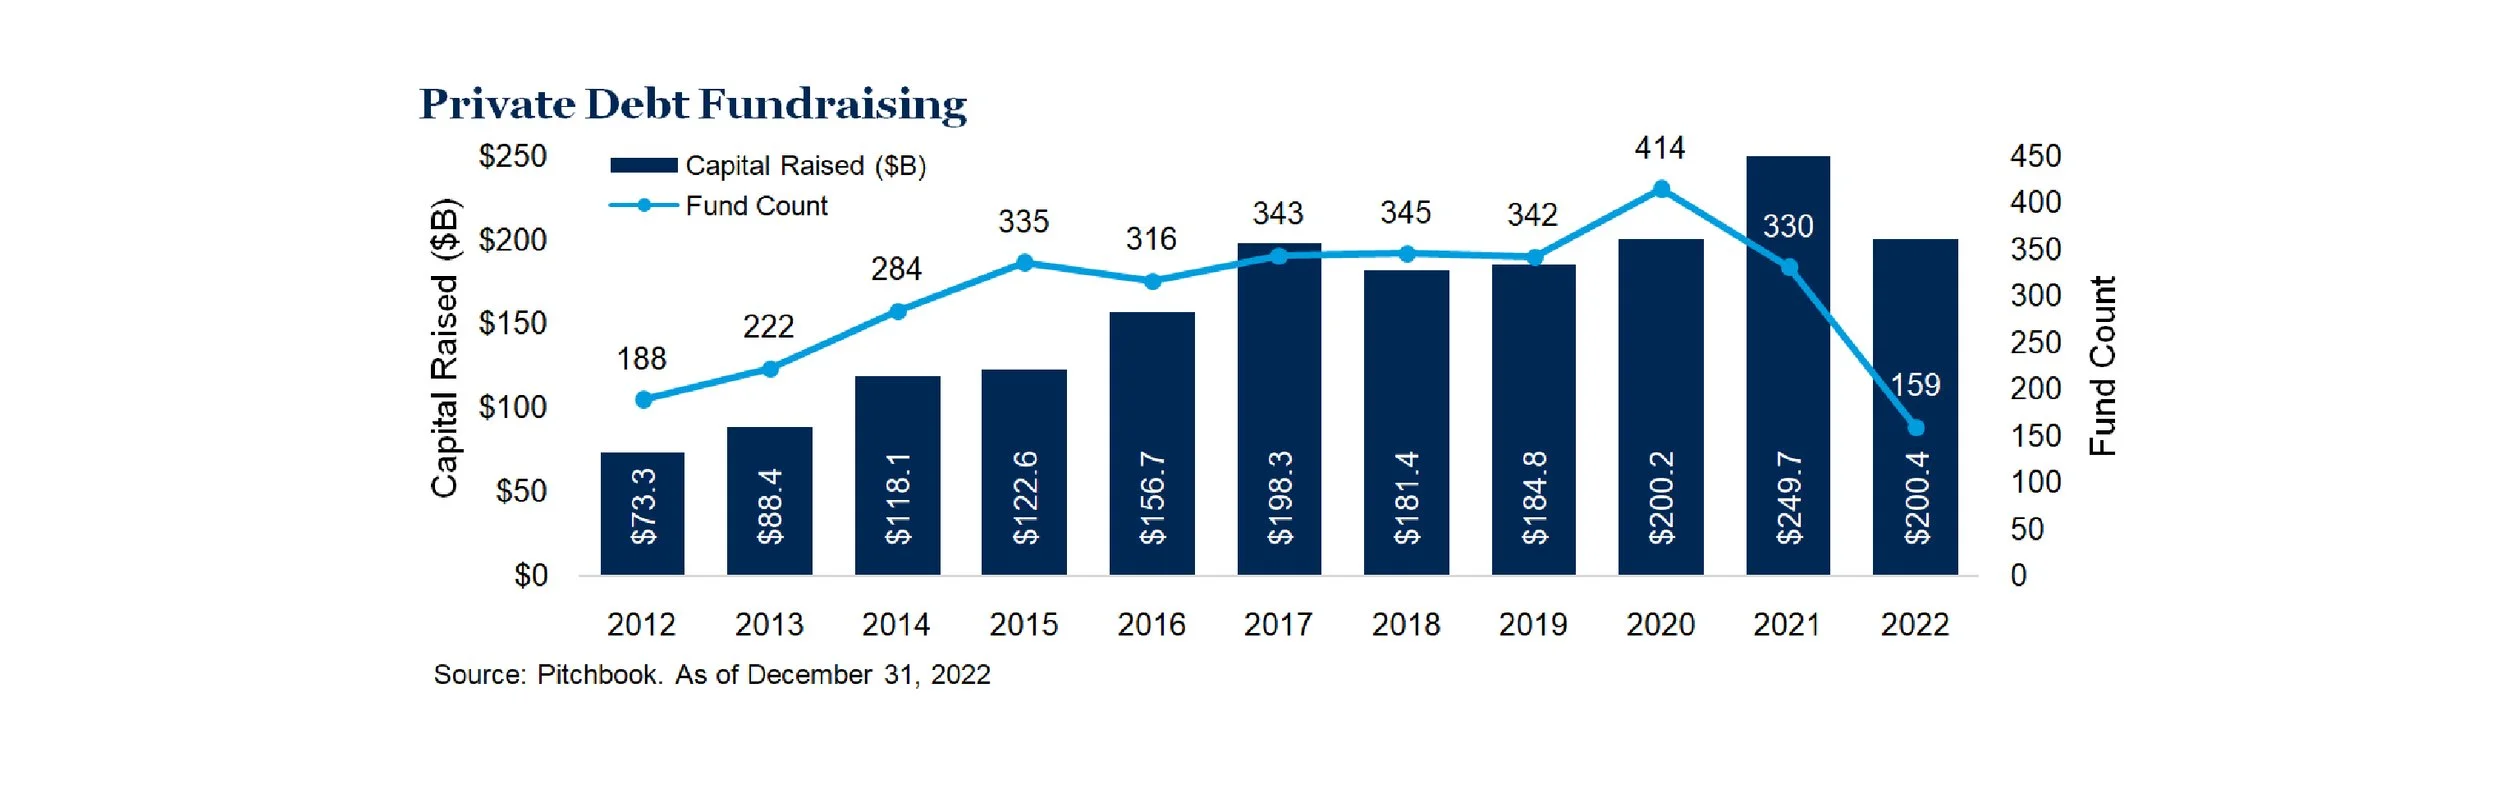
Private credit has garnered increasing popularity as an option for investors seeking to increase yield across the portfolio. The market has grown meaningfully after the 2007/08 financial crisis, filling a void after banks took a step back as lenders. Assets under management grew substantially during the period of ultra-low interest rates as investors stretched to add yield to their portfolios.
Historically, the private credit asset class was principally dominated by institutional investors utilizing closed-ended illiquid structures. However, its appeal has expanded as more liquid structuring options have become available, such as private/public BDCs and open-ended evergreen structures, that encompass different levels of liquidity, fees and client eligibility. In terms of current market opportunity, we believe that the private debt markets are becoming increasingly efficient and greater return is likely coming with greater risk. Given this backdrop we recommend caution. Rising interest rates, which have disproportionately added credit risk to this space versus fixed rate bonds, and a growing mismatch of the illiquidity of the assets and the offered liquidity of the investment vehicles create additional risks.
However, for those interested in the space we think there are a number of important components to consider. Incorporating private credit into portfolios depends on investors’ unique return objectives and risk tolerances. Within portfolios, capital is typically sourced from traditional public fixed income (corporate high yield) and marketable alternatives due to their similarity in return profile. For specific portfolios that have a significant allocation to fixed income, incorporating private credit into the asset allocation can offer diversification benefits and potentially generate additional yield. Conversely, for investors with distinct ‘illiquid buckets’, we believe the opportunity cost of allocating away from private equity to private credit is not justified. Regarding types of managers to invest with, we have a strong preference to partner with private credit firms that lend more senior in the capital structure (more secure) and are the sole lender (easier to foreclose, work through issues and greater fee collection). Overall, investors considering private credit must carefully weigh the benefits against the liquidity constraints, credit risks and increased due diligence demands associated with this asset class.
OUTLOOK
Year-to-date, there have been a plethora of market shaking events – a banking crisis, a debt ceiling impasse, tightening financial conditions, negative earnings growth – but July was a welcomed reprieve from the noise and markets by and large have held their ground. However, even with reasonably strong economic data being reported, there are signs of elevated potential for a slowing business cycle. As highlighted in our Mid-Year Outlook, we believe thoughtful asset allocation will be as important as ever in this environment of higher interest rates, tighter financial conditions and moderating inflation.
1) U.S. Bureau of Economic Analysis. As of July 27, 2023.
2) U.S. Bureau of Labor Statistics. As of July 12, 2023.
3) https://www.federalreserve.gov/monetarypolicy/openmarket.htm. As of July 26, 2023.
For more information and assistance, please contact any of the professionals at Crescent Wealth Advisory.
Download a PDF of this blog.
Comparisons to any indices referenced herein are for illustrative purposes only and are not meant to imply that actual returns or volatility will be similar to the indices. Indices cannot be invested in directly. Unmanaged index returns assume reinvestment of any and all distributions and do not reflect our fees or expenses.
• The S&P 500 is a capitalization-weighted index designed to measure performance of the broad domestic economy through changes in the aggregate market value of 500 stocks representing all major industries.
• Russell 2000 consists of the 2,000 smallest U.S. companies in the Russell 3000 index.
• MSCI EAFE is an equity index which captures large and mid-cap representation across Developed Markets countries around the world, excluding the U.S. and Canada. The index covers approximately 85% of the free float-adjusted market capitalization in each country.
• MSCI Emerging Markets captures large and mid-cap representation across Emerging Markets countries. The index covers approximately 85% of the free-float adjusted market capitalization in each country.
• Bloomberg U.S. Aggregate Index covers the U.S. investment grade fixed rate bond market, with index components for government and corporate securities, mortgage pass-through securities, and asset-backed securities.
• Bloomberg U.S. Corporate High Yield Index covers the universe of fixed rate, non-investment grade debt. Eurobonds and debt issues from countries designated as emerging markets (sovereign rating of Baa1/BBB+/BBB+ and below using the middle of Moody’s, S&P, and Fitch) are excluded, but Canadian and global bonds (SEC registered) of issuers in non-EMG countries are included.
• FTSE NAREIT Equity REITs Index contains all Equity REITs not designed as Timber REITs or Infrastructure REITs.
• Bloomberg Commodity Index is calculated on an excess return basis and reflects commodity futures price movements. The index rebalances annually weighted 2/3 by trading volume and 1/3 by world production and weight-caps are applied at the commodity, sector and group level for diversification.